
Type II solar bursts are radio signatures of shock waves in the solar corona driven by solar flares or coronal mass ejections. Therefore, these bursts present complex spectral morphologies in solar dynamic spectra. In particular, the radio emission lane may separate into two thinner bands that is known as band-splitting (Vršnak et al., 2002). “Fractured” type II bursts, exhibiting spectrally indented shapes in the form of bumps or breaks, are attributed to the collisions of shock waves with coronal density structures (Koval et al., 2021). Furthermore, type II burst can have a herringbone appearance in solar spectrogram (Cairns & Robinson, 1987). Such a burst consists of the positively and negatively drifting sub-bursts (“herringbones” or shortly “HBs”) diverging from the main backbone towards higher and lower frequencies, respectively. The “HBs” are regarded to be manifestations of electron beams accelerated by the shock wave associated with the type II burst. The “HBs” can be exploited to study turbulent nature of the background coronal plasma by applying a power spectral density (PSD) analysis to their flux variations (Carley et al., 2021). The theoretical grounding for the above-mentioned approach has been introduced by Reid & Kontar, 2017 who demonstrated that density turbulence in the solar corona can modulate the level of Langmuir waves. In their turn, these modulations of Langmuir waves or Langmuir wave clumping can induce intensity variations of subsequent plasma radio emission. Later, Reid & Kontar, 2021 could quantitatively show that type III burst fine structure is caused by the coronal density turbulence. Since types III, IIIb bursts as well as herringbones in type II bursts are produced by electron beams, the proposed method of studying of coronal density fluctuations is valid for all these types of solar radio bursts. Here, we report about radio observations of complex type II solar burst with a medley of spectral features. In this work we especially focus on the PSD analysis of the herringbone structure of this burst to investigate properties of coronal density turbulence.
Data Analysis and Results
In our research, we have recognized complex type II solar burst observed by Ukrainian radio facilities, namely Ukrainian T-shaped Radio telescope, second modification (UTR-2) and Giant Ukrainian Radio Telescope (GURT) on July 25th, 2014 (see Figure 1). The recorded type II burst, entitled as “HB Type II-F/H”, shows a collection of spectral features such as fundamental-harmonic components, band-splitting, herringbone structure, and spectral break. These specific spectral features together in type II bursts are rarely detected. The herringbone structure of the burst will be under our primary analysis.
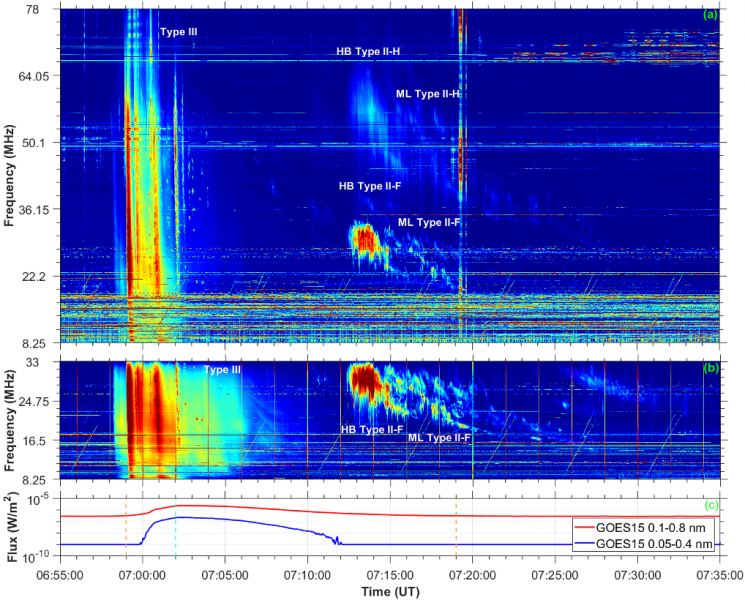
Figure 1. The time-aligned solar dynamic spectra obtained by the Ukrainian radio facilities, namely the GURT (8.25-78 MHz) (a) and UTR-2 (8.25-33 MHz) (b) antenna arrays on July 25th, 2014. The fundamental (F) and harmonic (H) components of the type II burst with a herringbone structure as well as a multi-lane type II burst are labeled on the spectrograms as HB Type II-(F,H) and ML Type II-(F,H), respectively. A group of type III bursts is denoted. The panel (c) represents the solar X-ray emission measured by GOES 15 on that day. The C2.2 class flare start/end and peak times are pointed by orange and cyan dashed vertical lines, respectively. The common time axis is in the range 06:55-07:35 UT.
To conduct the PSD analysis of the HB Type II burst, we picked 10 forward (drift from high to low frequencies) well-resolved herringbones. The inverse herringbones were not selected since they are not spectrally distinct but rather blurry. Then, to calculate PSD values, we firstly establish intensities of HBs versus heliocentric distances following the next procedure. It can be described on the example of one prominent herringbone contained inside green rectangular area marked on the GURT spectrogram (Figure 2(a)). However, to perform PSD analysis we make use of the UTR-2 data expressed in absolute flux-density units. Figure 2(c) shows the calibrated UTR-2 dynamic spectrum within 18-28 MHz frequency range including the same herringbone. There the herringbone is manually isolated by orange line segments for determination of the flux density maxima in each frequency channel. The maxima are pointed by white dots along the herringbone. The flux density maxima versus frequency profile are plotted in Figure 2(d). To convert the frequency profile into heliocentric distances, the correct model of electron density should be applied. Thus, the model allows one to determine the plasma frequency at a specific height. We use a partial Saito density model with a multiplier factor of 0.6. By applying the partial Saito model, a relation of flux densities, extracted from the considered herringbone, to heliocentric distances was determined and plotted in Figure 2(e).
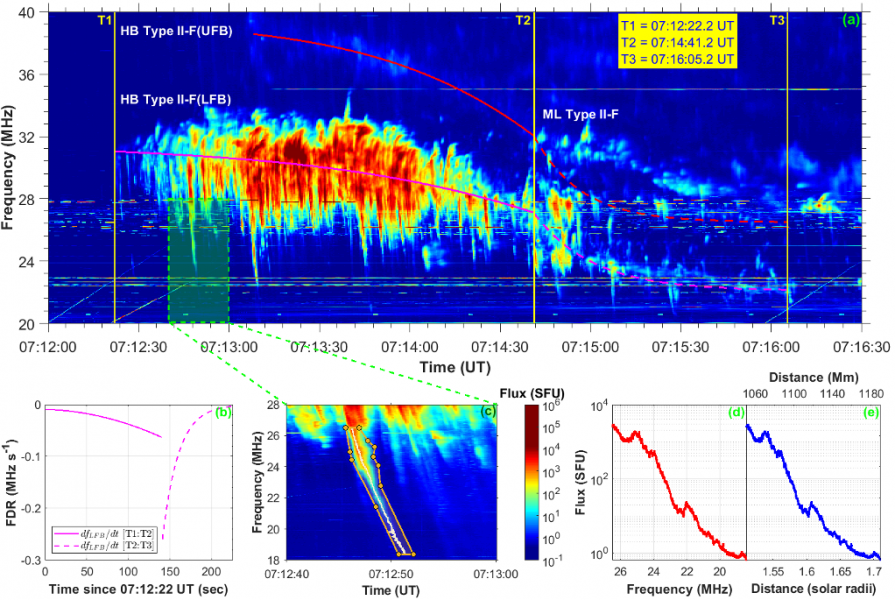
Figure 2. (a) The GURT dynamic spectrum of the fundamental component of the HB Type II radio burst. Lower and upper frequency bands of the component are labeled as LFB and UFB, respectively. Fitting of pre-break and post-break parts of both bands is performed. The beginning part of the fundamental component of the multi-lane type II burst, ML Type II-F, is pointed. The yellow vertical lines indicate time instants T1, T2, and T3. (b) Frequency drift rates, dfLFB/dt, of the pre-break (T1-T2 time interval; solid line) and post-break (T2-T3 time interval; dashed line) parts of the LFB. (c) The UTR-2 spectrum showing one exemplarily selected herringbone for the power spectral density analysis. The polygon, isolated manually by segments colored in orange, confines the herringbone. The flux density maxima in each frequency channel along the herringbone are pointed by white dots inside the polygon. (d) The flux density maxima vs. frequency for the selected herringbone. (e) A plot of flux vs. distance in solar radii (lower x-axis) and in megameters (upper x-axis) using a partial Saito model.
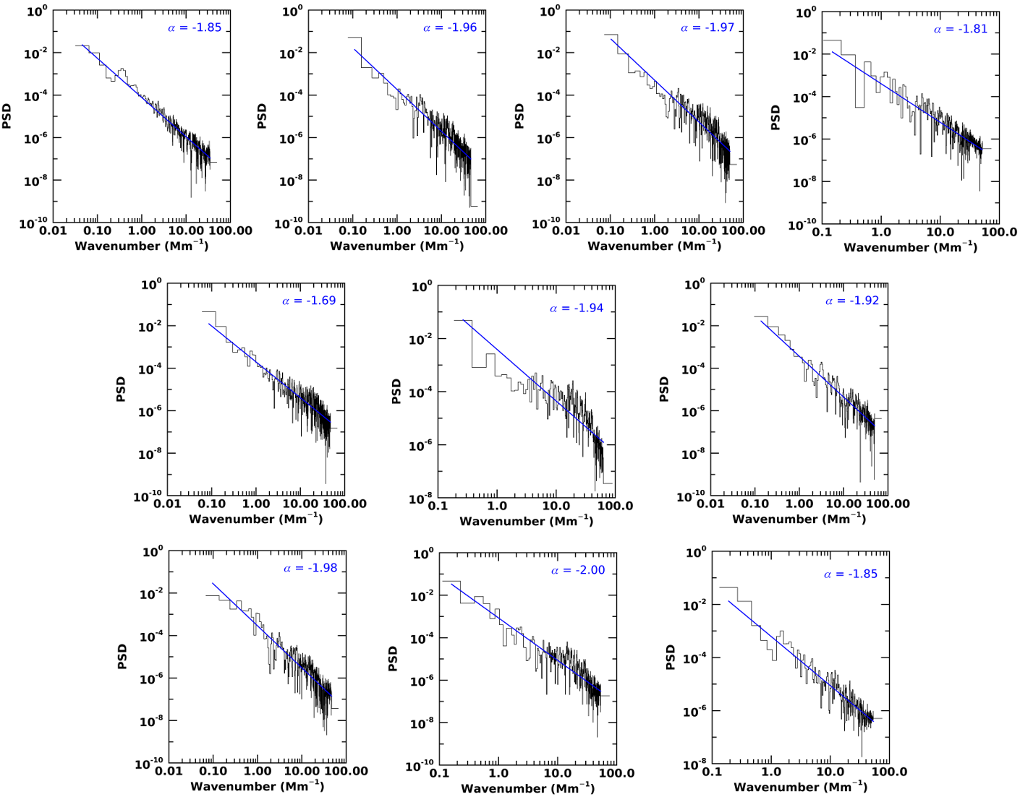
Figure 3. PSD analysis of the intensity fluctuations taken from 10 selected herringbones. Fittings of PSD values were performed with a power law in the form P(k)~ kα, where k is the wavenumber and α is the spectral index. The fitting curves are represented by blue solid lines. The obtained spectral indices α are shown.
Eventually, the PSD values were calculated. Thus, we obtain the distribution of size scales of coronal plasma turbulence which is regarded to be responsible for the flux variations in herringbones. Figure 3 shows the result of the PSD analysis for the 10 HBs. The upper-left panel in the figure corresponds to the herringbone shown on Figure 3(c). The PSD magnitudes were fit with a power law in the form P(k)~ kα, where k is the wavenumber in units of inverse Mm (k=2π/λMm), and is the spectral index. We find spectral indices varying in the range from -1.69 to -2.00 with an average value of αm= -1.897 and standard deviation of 0.0966. Only one α= -1.69 closely matches the Kolmogorov spectral index of -1.67, while other indices are higher modulo.
Conclusions
In this work, we were keen to study properties of coronal density turbulence by analyzing the herringbone structure of the HB type II. We have performed PSD analysis of the flux density fluctuations in 10 selected herringbones. The obtained spectral indices vary from α = -1.69 to -2.0. We consider these values as plausible. Their deviations from the tentatively expected Kolmogorov value can be attributed to internal behavior of plasma inhomogeneities in a range of radial distances from α≈1.44 to ≈1.71 solar radii. Moreover, we found that the HBs preceded the spectral break which is associated with piercing of a streamer by rising shock wave. It implies that the HBs were spatially generated in a region below the cusp point of the streamer. Therefore, the PSD analysis of the HBs provides properties of electron plasma turbulence in the coronal streamer that is a novelty of this work. These results cope with a relevant task in the physics of solar plasma – probing properties of density turbulence in the corona in a routine way. We believe the PSD analysis applied to herringbones can be an efficient and serviceable tool to get information about plasma turbulence in the solar corona.
Besides, in the dynamic spectrum we recognized a multi-lane type II burst beginning simultaneously with the spectral break in the HB type II (ML type II in Figures 1(a, b) and 2(a)). We consider this episode as very important since it is in line with the proposed scenario responsible for the occurrence of type II bursts as a result of the CME/shock-streamer interaction (e.g. Cho et al., 2008). Firstly, we are able to confirm this scenario based on examination of solar dynamic spectra without using the radio/optical/extreme ultraviolet imaging observations of the Sun and solar corona.
Based on a recently published article: Koval, A. Stanislavsky, M. Karlický, B. Wang, S. Yerin, A. Konovalenko, and M. Bárta (2023). Morphology of Solar Type II Bursts Caused by Shock Propagation through Turbulent and Inhomogeneous Coronal Plasma, Astrophysical Journal, 952, 2 DOI: 10.3847/1538-4357/acdbcc
References:
Cairns, I. H. & Robinson, R. D., 1987, SoPh, 111, 365
Carley, E. P., Cecconi, B., Reid, H. A. et al., 2021, ApJ, 921, 3
Cho, K.-S., Bong, S.-C., Kim, Y.-H. et al., 2008, A&A, 491, 873
Koval, A., Karlický, M., Stanislavsky, A. et al., 2021, ApJ, 923, 2
Reid, H. A. S. & Kontar, E. P., 2017, A&A, 598, 44
Reid, H. A. S. & Kontar, E. P., 2021, NatAs, 5, 796
Vršnak, B., Magdalenić, J., Aurass, H., & Mann, G., 2002, A&A, 396, 673