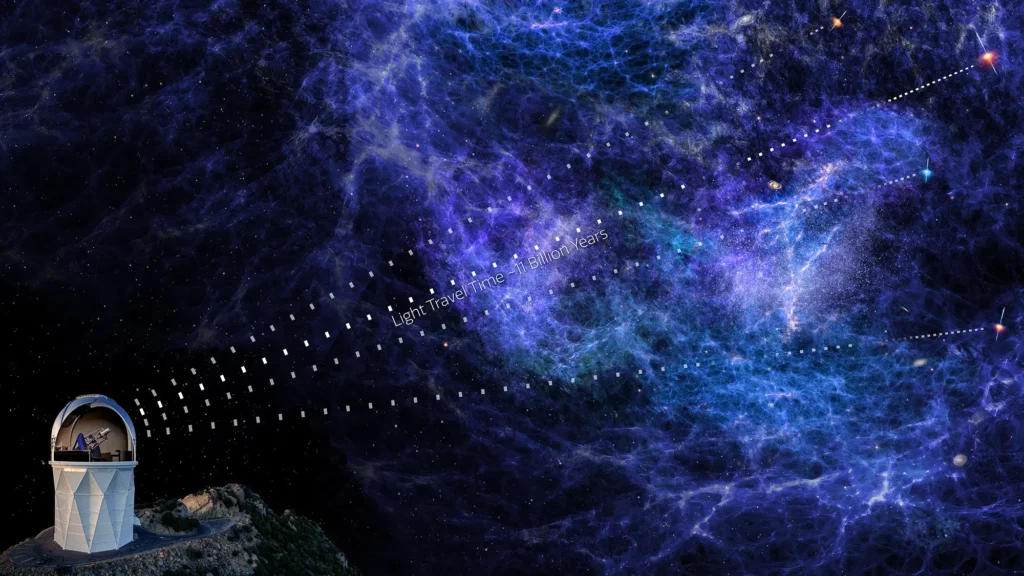
The Dark Energy Spectroscopic Instrument (DESI) has transformed our understanding of the cosmos by providing the most accurate measurement yet of the universe’s expansion. Situated atop a mountain in Arizona, DESI employs an innovative array of 5,000 tiny robots within a telescope to capture light from galaxies up to 11 billion light-years away. Scientists can now observe the universe as it was in its formative years and chart its evolution to the present day.
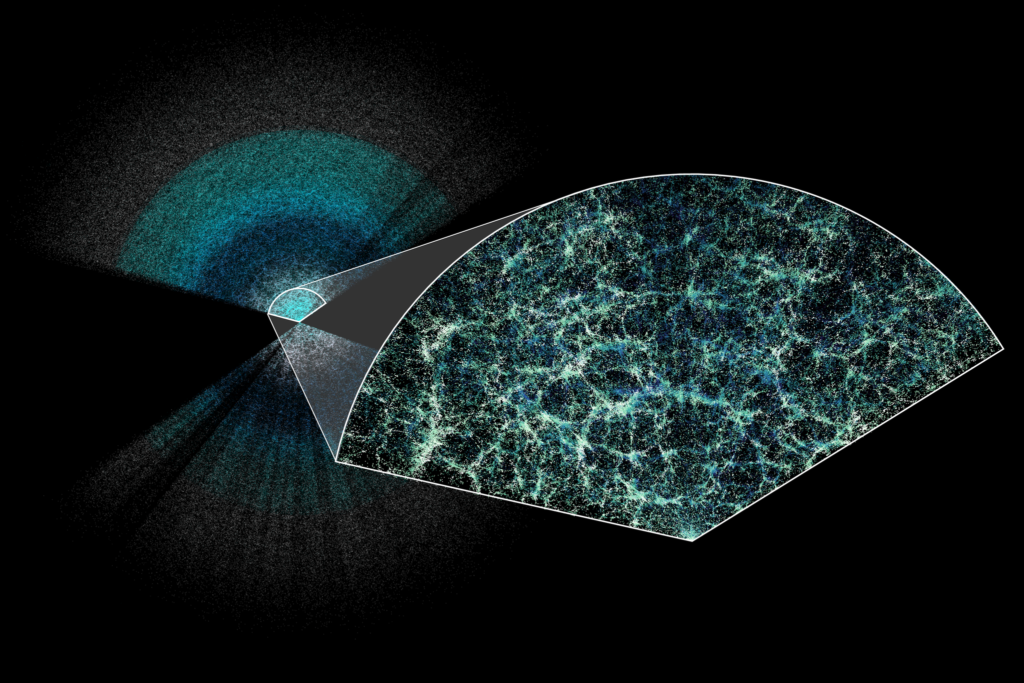
At the heart of this achievement is the study of the effects of dark energy, the elusive force that causes the universe to expand increasingly rapidly. To achieve this goal, data from DESI was used to make the largest 3D map of the universe ever made thus far. It’s also the most precise, having measured the expansion history of the early universe with an error of less than 1%.
Measuring the young universe poses an incredible challenge. However, within just one year, DESI has doubled its effectiveness in charting the expansion history of these early times compared to its predecessor, the Sloan Digital Sky Survey’s BOSS/eBOSS, which required more than a decade to achieve similar results.
“We’re incredibly proud of the data, which have produced world-leading cosmology results and are the first to come out of the new generation of dark energy experiments,” said Michael Levi, DESI director and a scientist at the Department of Energy’s Lawrence Berkeley National Laboratory (Berkeley Lab), which manages the project.
“So far, we’re seeing basic agreement with our best model of the universe, but we’re also seeing some potentially interesting differences that could indicate that dark energy is evolving with time. Those may or may not go away with more data, so we’re excited to start analyzing our three-year dataset soon.”
Mapping the Cosmic Web
This mapping effort is more than a technological triumph. It represents a significant collaborative achievement, involving over 900 researchers from over 70 institutions worldwide. The instrument itself is located at the Nicholas U. Mayall 4-meter Telescope at Kitt Peak National Observatory, a site of profound importance to the Tohono O’odham Nation, a Native American people.
One of the most intriguing outcomes of DESI’s observations is the potential challenge it poses to the Lambda Cold Dark Matter (Lambda CDM) model. Lambda CDM incorporates both a weakly interacting form of matter known as cold dark matter (CDM) and dark energy (Lambda). These components have contrasting effects on the universe’s expansion: while matter and dark matter decelerate it, dark energy accelerates it. The proportion of each dictates the evolution of our universe. This model effectively explains outcomes from prior experiments and the universe’s appearance over time.
Yet, when the astronomers integrated the first-year results from DESI with data from other studies, they noticed some minor discrepancies with Lambda CDM’s predictions. As such, the foundation for our understanding of the universe’s composition and expansion may need to be revised.
The data suggest that dark energy — the mysterious force driving the universe’s accelerated expansion — might evolve over time. And this idea could revolutionize our cosmological theories.
As DESI continues its five-year survey and collects more data, scientists will be better equipped to interpret these initial findings. Additional data will also enhance DESI’s preliminary findings on the Hubble constant, which measures the current expansion rate of the universe, and the mass of neutrinos.
DESI and the early universe
“We are delighted to see cosmology results from DESI’s first year of operations,” said Gina Rameika, associate director for High Energy Physics at the Department of Energy. “DESI continues to amaze us with its stellar performance and is already shaping our understanding of the universe.”


DESI, which has been 14 years in the making, hinges on a super high-tech telescope at Kitt Peak equipped with over 5,000 fiber-optic detectors. These instruments allow the telescope to track and conduct spectroscopy on millions of galaxies simultaneously. Essentially, astronomers measure how fast these galaxies are moving away from Earth and then use this data to travel backward in time towards “T zero”, when it started.
This map reveals the universe’s early state. Back then, it was densely packed with subatomic particles that would eventually form atoms of hydrogen and helium. As the universe expanded and cooled, these particles settled into a pattern of ripples and clusters, setting the stage for the formation of galaxies.
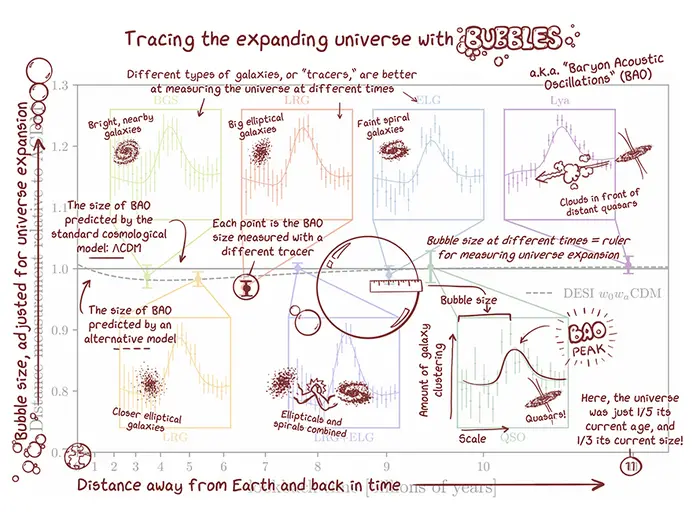
Tiny fluctuations in the early ionized plasma triggered pressure waves, propelling baryons into a ripple pattern akin to what appears when you throw a handful of gravel into a pond. As the universe expanded and cooled, neutral atoms formed, halting the pressure waves and thus freezing the ripples in three dimensions. This process led to the increased clustering of future galaxies in denser areas. Billions of years later, this faint pattern of 3D ripples, or bubbles, still marks the characteristic separation of galaxies, a phenomenon known as Baryon Acoustic Oscillations (BAOs).
Mapping the velocity of millions of galaxies
Researchers utilize BAO measurements as a cosmic ruler. By assessing the apparent size of these bubbles, they can calculate distances to the matter that created this extremely faint pattern in the sky. Mapping BAO bubbles both near and distant allows researchers to segment the data. With this they can determine the universe’s expansion rate at different points in its history and, further, how dark energy influences this expansion.


Measuring the expansion history and gaining a better understanding of dark energy through galaxies is one approach, but its reach has limits. Beyond a certain distance, light from typical galaxies becomes too faint, prompting researchers to focus on quasars.
Quasars are extremely distant and bright galactic cores harboring black holes at their centers. As light from these quasars travels through intergalactic clouds of gas, it gets absorbed allowing researchers to chart the dense matter pockets. They apply this information similarly to how they use galaxies, employing a technique known as the “Lyman-alpha forest.”
“We use quasars as a backlight to basically see the shadow of the intervening gas between the quasars and us,” said Andreu Font-Ribera, a scientist at the Institute for High Energy Physics (IFAE) in Spain who co-leads DESI’s Lyman-alpha forest analysis. “It lets us look out further to when the universe was very young. It’s a really hard measurement to do, and very cool to see it succeed.”
The golden era of cosmology
The researchers have utilized the largest dataset ever collected for Lyman-alpha forest measurements, comprising 450,000 quasars, to extend their BAO measurements as far back as 11 billion years. By the survey’s conclusion, DESI aims to map 3 million quasars and 37 million galaxies.
Upon compiling their data, researchers discovered that the typical assumption of constant dark energy failed to accurately describe the universe’s expansion. Galaxies from the three most recent epochs seemed closer than expected, indicating that dark energy might be changing over time.
“We are in the golden era of cosmology, with large-scale surveys ongoing and about to be started, and new techniques being developed to make the best use of these datasets,” said Arnaud de Mattia, a researcher with the French Alternative Energies and Atomic Energy Commission (CEA) and co-leader of DESI’s group interpreting the cosmological data. “We’re all really motivated to see whether new data will confirm the features we saw in our first-year sample and build a better understanding of the dynamics of our universe.”
The findings were reported in multiple papers that appeared today.
Thanks for your feedback!


